
Pakistan’s chemical manufacturing industry is a critical part of the country’s industrial economy, supporting sectors such as textiles, agriculture, pharmaceuticals, paints, construction materials, and consumer goods. The sector consists of 28 publicly listed chemical manufacturers, with several dominant players shaping production capacity, pricing trends, and capital investment decisions. Among the most influential companies are Lucky Core Industries, Engro Polymer & Chemicals, Nimir Industrial Chemicals, Ittehad Chemicals Limited, and Sitara Chemical Industries. These firms collectively command a large share of the sector’s revenue and production output, setting the tone for pricing, technological investment, and market expansion
Sector-Wide Revenue Dynamics
In the high-stakes chemical manufacturing landscape, revenue growth acts as a vital proxy for market share dominance and demand resilience. For the 2021–2025 period, top-line trajectories reflect a sector grappling with radical structural shifts and cost-push inflation. Scale is no longer just a metric of size; it has become a necessary buffer for absorbing the fixed-cost burdens and supply chain shocks inherent in emerging market manufacturing. The ability to scale determines which entities can dictate pricing power versus those forced to absorb margin compression. This is best seen in the chart Revenue 1.
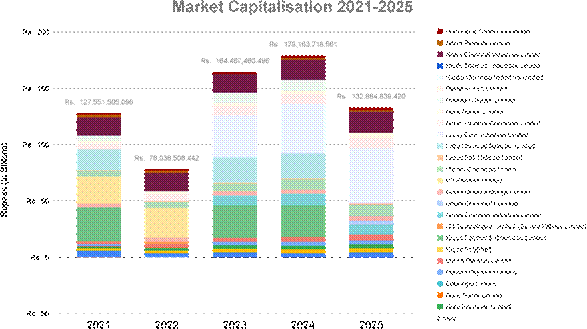
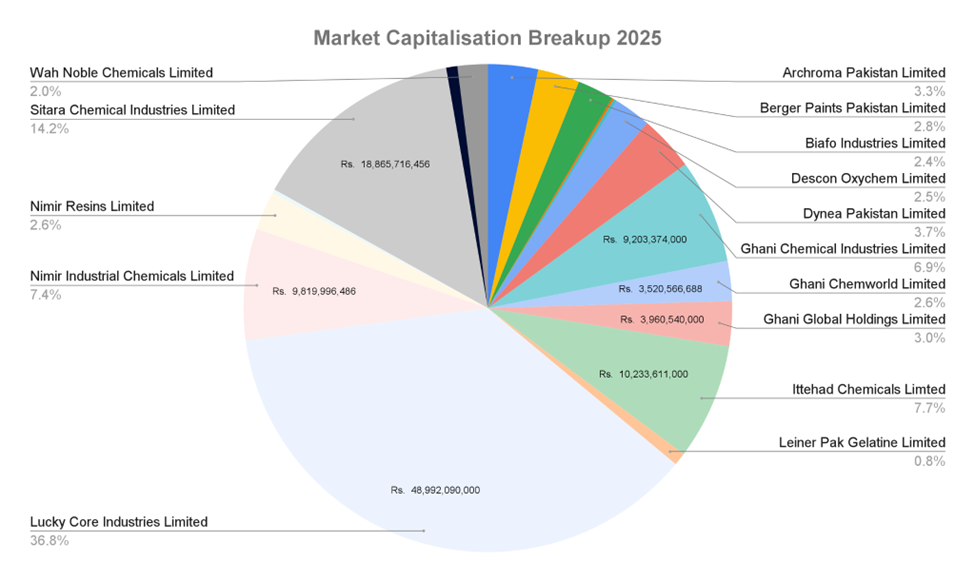
A rigorous analysis of the "Revenue" and "Market Capitalisation" datasets reveals a significant "Great Divergence" between high-scale conglomerates and specialized niche players. The most prominent strategic shift is the rebranding and successor trajectory of ICI Pakistan Limited into Lucky Core Industries. While raw data might suggest Lucky Core appeared from a vacuum in 2023, a sophisticated synthesis shows it inherited a massive revenue base (Rs. 62.62 Bn in 2021), effectively doubling its scale to Rs. 120.01 Bn by 2025. This consolidation, alongside Engro Polymer & Chemicals—which peaked at Rs. 81.22 Bn in 2023—highlights a massive concentration of sector power among players with the capital depth to navigate macroeconomic headwinds. See the table and chart Revenue 2.
Revenue Leaders vs. Emerging Growth (2021 vs. 2025)
| Company | 2021 Revenue (Rs.) | 2025 Revenue (Rs.) | Growth Profile/Reason |
| Lucky Core Industries* | 62.62 Bn | 120.01 Bn | Consolidated Market Leadership |
| Nimir Industrial Chemicals | 23.09 Bn | 45.26 Bn | High Growth |
| Ittehad Chemicals | 11.12 Bn | 27.86 Bn | Organic Segment Expansion |
| Biafo Industries | 1.47 Bn | 2.90 Bn | Mid-Level Growth |
| Data Agro Limited | 191.63 Mn | 353.21 Mn | Niche Segment Resiliency |
*2021 baseline utilizes ICI Pakistan Limited data as the predecessor entity.
This concentration reflects a strategic flight to scale. While smaller firms like Data Agro successfully defends niche segments, the broader sector is trending toward dominance by heavyweights who can leverage massive capital outlays to secure feedstock and logistics. However, revenue scale is only a precursor to the more critical metric of sustainable profitability.
Earnings Before Tax (EBT) and Net Income Volatility
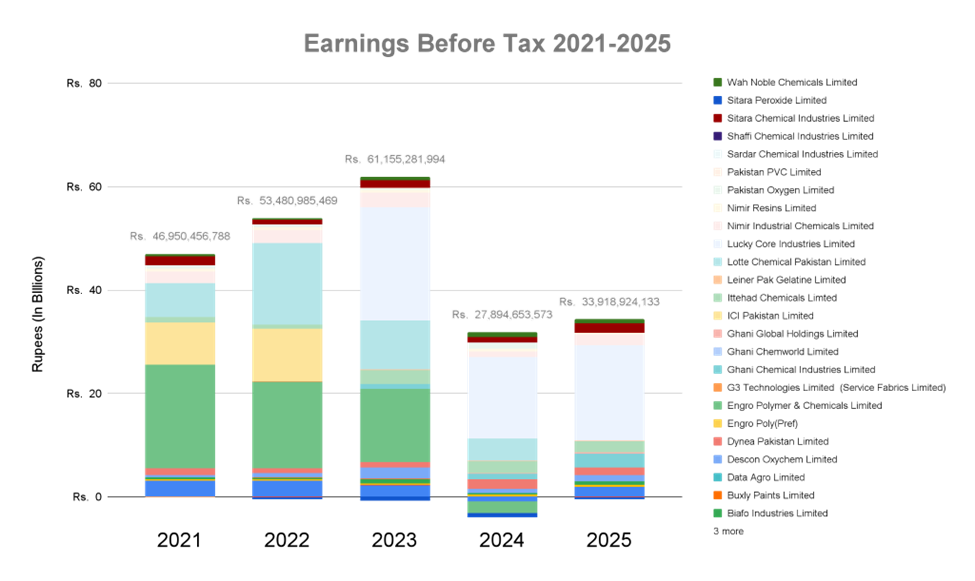
Earnings Before Tax (EBT) and Net Income serve as the ultimate pressure gauges for a company’s operational health. In the 2021–2025 cycle, these metrics distinguished firms with robust hedging and pricing power from those vulnerable to interest rate hikes and feedstock volatility. For C-suite planners, unstable earnings are the primary deterrent to sustainable capital reinvestment and long-term strategic positioning. See chart Earnings 1.
The contrast in earnings trajectories defines the sector’s risk profile:
Operating Volatility: Archroma Pakistan Limited demonstrated extreme market-driven swings, moving from a healthy Rs. 3.19 Bn EBT in 2021 to a loss of Rs. 811 Mn in 2024, before a 2025 recovery to Rs. 1.93 Bn. This suggests a firm sensitive to cyclical market troughs but possessing the operational leverage to rebound.
Structural Stability: Berger Paints Pakistan remained a pillar of consistency, growing EBT from Rs. 267 Mn in 2021 to Rs. 464 Mn in 2025, reflecting a defensive market position and disciplined cost management.
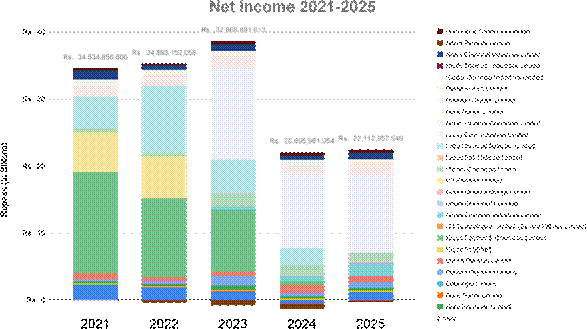
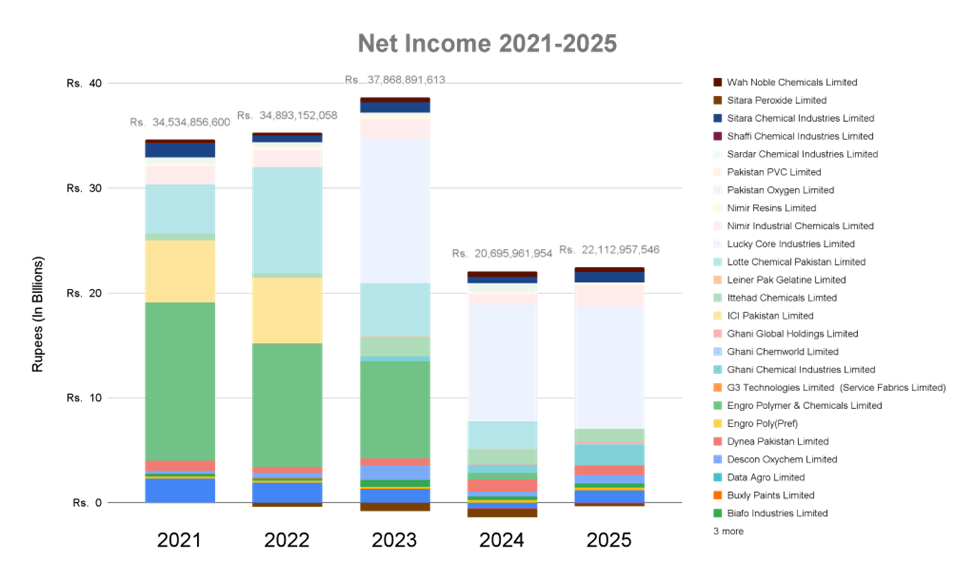
Operational resilience was most pronounced in Sitara Chemical Industries and Nimir Industrial Chemicals, both of which maintained positive Net Income throughout the five-year cycle despite severe economic headwinds. This is best seen in chart Net Income 1. Conversely, the sector contains significant "Earnings Shocks" that demand scrutiny:
Bawany Air Products: Reported a massive EBT spike in 2023 (Rs. 59.39 Mn) despite generating zero revenue. For strategists, this must be flagged as non-operating income—likely a one-time asset disposal—rather than operational performance.
Sitara Peroxide: Suffered a downward spiral, with losses deepening to -Rs. 222.5 Mn by 2025.
Shaffi Chemical Industries: Exhibited consistent losses, widening significantly toward the end of the period.
These fluctuations underscore a critical reality: without stabilized earnings, capital efficiency remains elusive, leading to a total erosion of the asset base for the sector’s laggards.
Capital Efficiency
For strategic management, Return on Equity (ROE) and Return on Assets (ROA) are the definitive indicators of how effectively a team extracts value from its shareholder capital and asset base. In an asset-heavy sector like chemicals, high revenue is a vanity metric if not accompanied by superior asset utilization. The return on equity for the sector is seen in chart Margin 1.
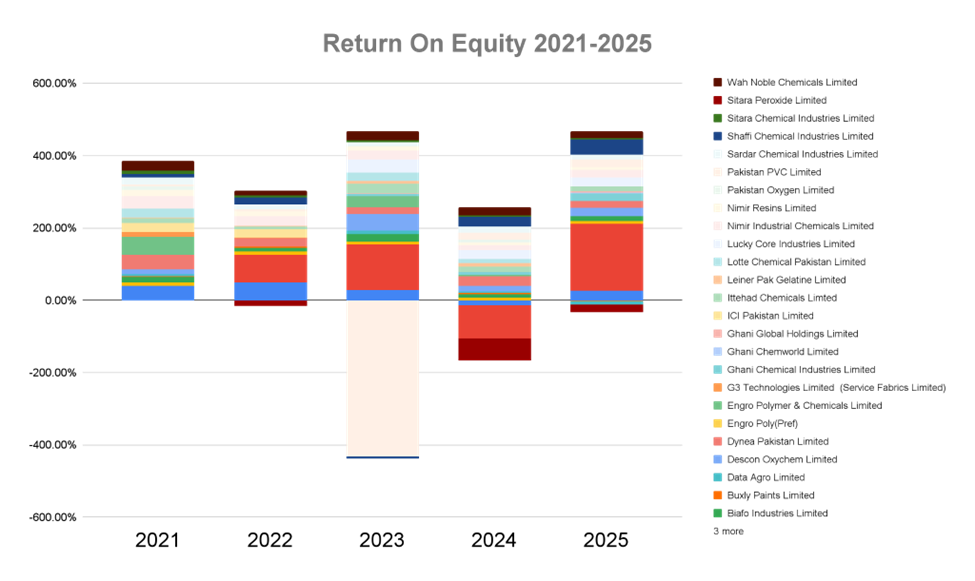
Efficiency leaders during this period, such as Dynea Pakistan Limited and Wah Noble Chemicals, maintained double-digit ROE/ROA for the majority of the cycle, signifying lean operations and optimized supply chains. Descon Oxychem emerged as a leader in 2025, though its 2022 data gap suggests a reporting lag or a significant structural turnaround rather than a steady-state performance.The return on equity for the sector is seen in chart Margin 2.
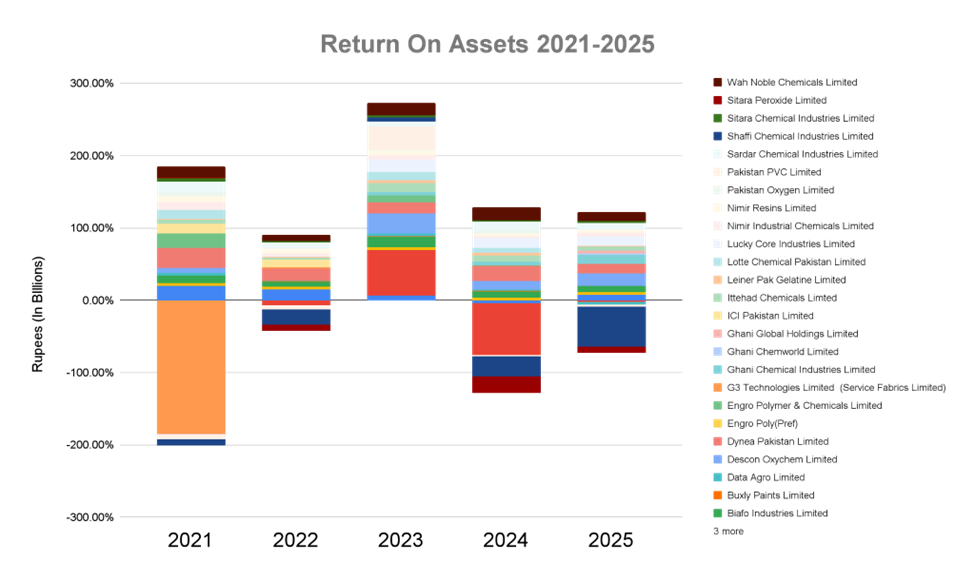
Efficiency Benchmarking (2025)
| Company | Return on Assets (ROA) | Net Profit Margin | Efficiency Rank |
| Descon Oxychem | 16.63% | 24.16% | 1 |
| Dynea Pakistan | 13.74% | 17.79% | 2 |
| Wah Noble Chemicals | 12.55% | 18.16% | 3 |
| Ghani Chemical Industries | 12.41% | 21.91% | 4 |
| Lucky Core Industries | 12.24% | 23.76% | 5 |
While the leaders thrived, "Distress Signals" in the data highlight entities nearing structural collapse. Shaffi Chemical Industries’ ROA of -55.34% in 2025 is not merely a "bad year"; it represents a total erosion of the asset base, where the company is effectively consuming its own capital to survive. Similarly, Sitara Peroxide’s chronic negative ROA signals that its current asset configuration is no longer viable. For strategists, these figures indicate an urgent mandate for asset rationalization or complete divestment, marking a definitive shift from growth-at-all-costs toward lean, hyper-efficient operational models.This is seen in the chart Margin 3.

Strategic Stability
To facilitate M&A and partnership decisions, firms in the chemical sector can be categorized into three distinct strategic archetypes based on their five-year performance footprint. This is derived from the chart Capital 1 & 2.
The Stabilizers (Defensive Value)
These firms provide consistent ROE and steady Net Income growth. They are the "safe havens" of the sector.
Key Examples: Berger Paints Pakistan, Nimir Resins, Sitara Chemical Industries.
Strategic Value: High. These are ideal partners for long-term supply contracts and offer low-risk profiles for conservative investors. Their ability to maintain margins suggests strong brand equity and pricing power.
The Cyclical Turnarounds (High-Risk/High-Reward)
Firms that experience market-driven volatility but maintain the capability for rapid recovery.
Key Examples: Archroma Pakistan, Ittehad Chemicals.
Strategic Value: Opportunistic. These firms present "M&A Arbitrage" opportunities—target them during EBT troughs to capture scale-driven recovery in the next market upswing.
Structural Laggards & Zombie Firms (Value Traps)
Entities with consistent negative market capitalization, chronic losses, or zero revenue operations.
Key Examples: Pakistan PVC, Shaffi Chemical Industries, Bawany Air Products.
Strategic Value: Low. These firms are "Zombie" entities that require total structural reorganization. Unless acquired for specific tax shields or undervalued land assets, they represent significant risk to capital.
Conclusion and Strategic Outlook for Corporate Planners
The 2021–2025 assessment reveals a chemical sector defined by a "Great Divergence." While giants like Lucky Core Industries have successfully converted scale into efficient returns (ROA > 12%), a significant tail of the sector is being hollowed out by cost-push inflation and asset inefficiency. The industry is trending toward consolidation, driven by the inability of small-scale firms and "Zombie" entities to absorb macroeconomic shocks.
Strategic Mandates:
Aggressive Asset Rationalization: For firms with negative ROA, management must pivot toward asset-light models or immediately divest underperforming units to stop capital erosion.
M&A Arbitrage: Corporate planners should monitor the "Cyclical" archetype, identifying acquisition targets at EBT troughs to capitalize on the next demand cycle.
Margin Protection & Scale: Scale is now a prerequisite for survival. Firms must seek mergers or high-margin specialization (e.g., specialty chemicals) to buffer against the volatility that has decimated the sector's laggards.
The sector's future belongs to those who prioritize capital efficiency over nominal growth, as the era of easy scaling without operational discipline has officially ended.
Disclaimer: This content is published solely for awareness, educational, public information, and journalistic purposes. All data is sourced from Pakistan Stock Exchange (dps.psx.com.pk) and relavant companies website.