The textile industry remains the cornerstone of Pakistan’s industrial economy and a primary constituent of the Pakistan Stock Exchange (PSX). For institutional investors, the PSX classification is more than an administrative grouping; it serves as a critical framework for risk assessment and capital allocation. These classifications delineate entities based on their position in the value chain, capital intensity, and sensitivity to macroeconomic shocks such as energy tariff hikes and global cotton price volatility.
The PSX segments the industry into four primary verticals:
- Textile Combined: Vertically integrated giants—including Nishat Mills, Interloop Limited, and Gul Ahmed—that manage the complete cycle from fiber processing to retail-ready apparel.
- Textile Spinning: Upstream specialists like Bhanero Textile and Faisal Spinning, focused on converting raw fiber into yarn.
- Textile Weaving: Midstream players such as Prosperity Weaving and Zephyr Textiles that convert yarn into fabric.
- Synthetic & Rayon: Specialized industrial segments producing man-made fibers, led by Ibrahim Fibres and Gatron Industries.
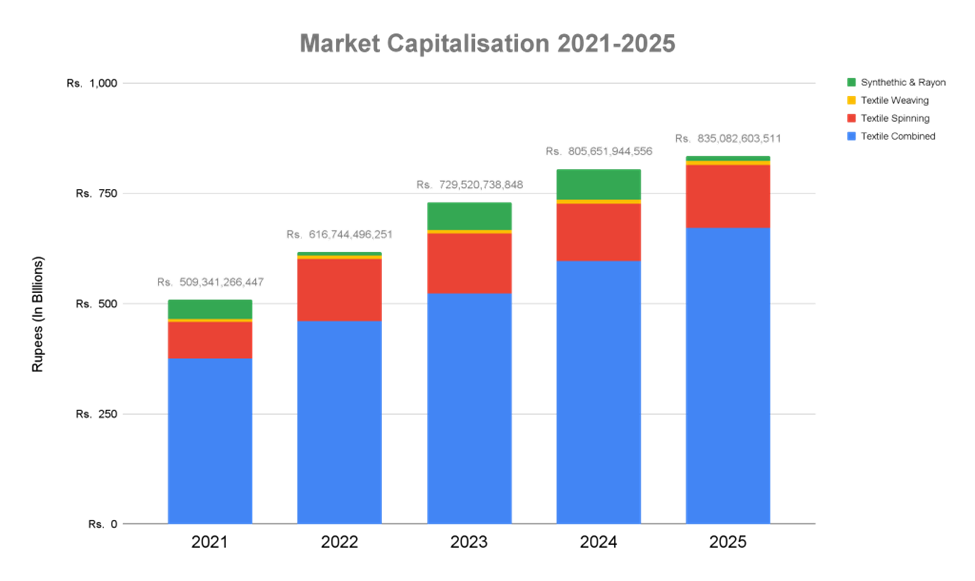
Functional differences between these segments dictate their respective risk profiles. While Textile Combined entities leverage value-added margins and scale to buffer against market turbulence, the Spinning and Weaving sectors operate as commodity-driven segments, making them highly susceptible to raw material "negative carry" and pricing power erosion. This structural bifurcation has become increasingly pronounced as the sector's top-line expansion masks a fundamental decay in market valuation. This is seen in chart Market Capitalisation 1.
Analysis of Industry Revenue and Market Capitalization Dynamics
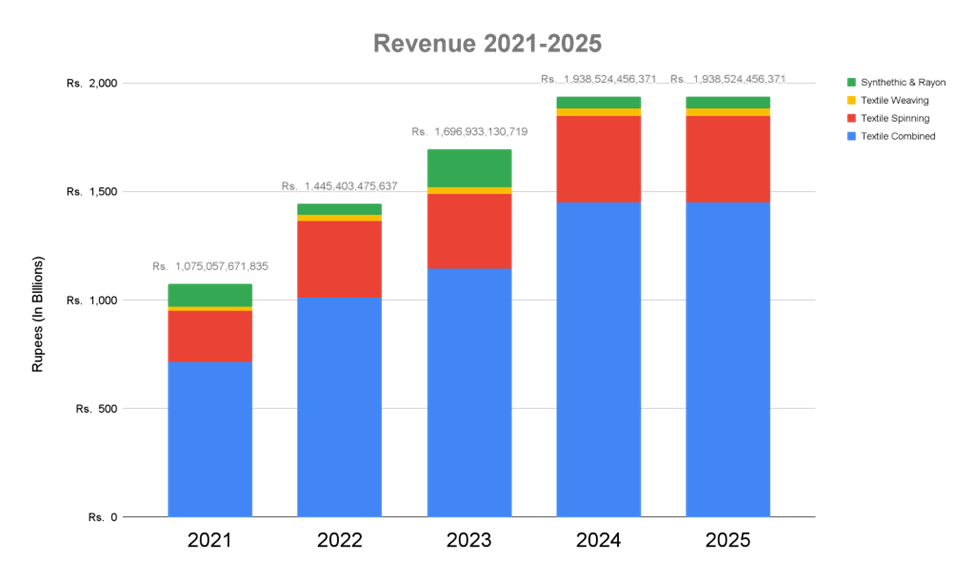
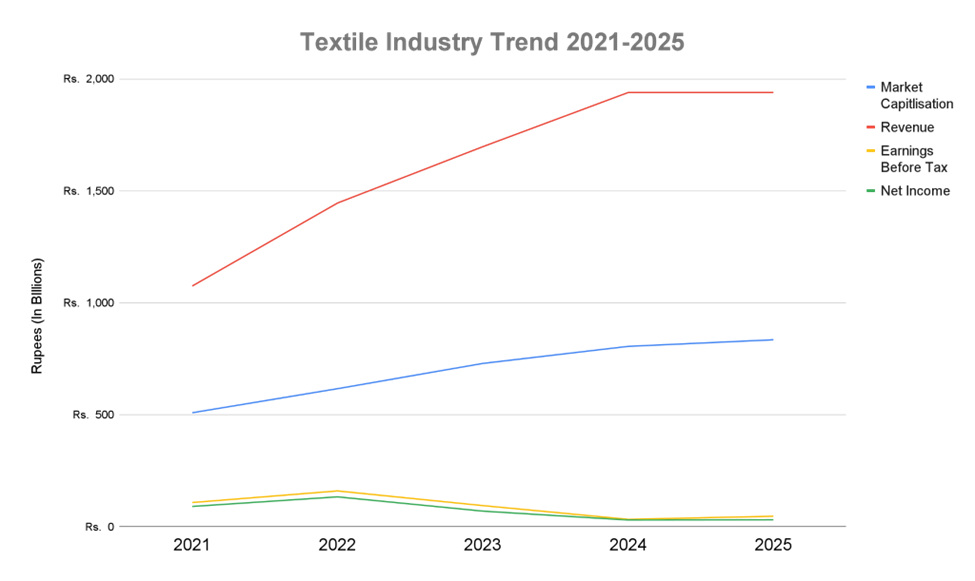
Between 2021 and 2025, the sector exhibited a deceptive macro-trend: massive revenue expansion set against severe economic headwinds. From an equity research perspective, this top-line growth represents "inflationary pass-through" and currency-driven bloating rather than organic operational health. As the Pakistani Rupee devalued, export-oriented revenues expanded nominally, but this has failed to translate into proportional shareholder value.
The Textile Combined sector saw revenue surge from Rs. 716.16 billion in 2021 to a peak of Rs. 1.45 trillion in 2024/2025— a doubling of the top line. However, the market has not rewarded this scale. While Market Capitalization for the combined sector reached Rs. 672.69 billion in 2025, the Synthetic & Rayon sector experienced a catastrophic valuation collapse, plummeting from a 2024 peak of Rs. 69.56 billion to a mere Rs. 10.89 billion by 2025. As seen in chart Revenue 1.
Revenue vs. Market Capitalization Trajectory (2021–2025)
| Sector | 2021 Revenue | 2022 (Peak) Revenue | 2025 Revenue | 2021 Market Cap | 2025 Market Cap |
| Textile Combined | Rs. 716.16B | Rs. 1.01T | Rs. 1.45T | Rs. 375.50B | Rs. 672.69B |
| Textile Spinning | Rs. 234.43B | Rs. 352.52B | Rs. 398.64B | Rs. 83.76B | Rs. 142.01B |
| Textile Weaving | Rs. 20.40B | Rs. 29.49B | Rs. 34.23B | Rs. 6.33B | Rs. 9.47B |
| Synthetic & Rayon | Rs. 104.05B | Rs. 50.19B | Rs. 55.54B | Rs. 43.74B | Rs. 10.89B |
This trajectory confirms that top-line scale has become decoupled from fundamental value, as capital impairment and margin compression now dominate the industrial landscape. This is seen in chart Trend 1.
The Profitability Paradox
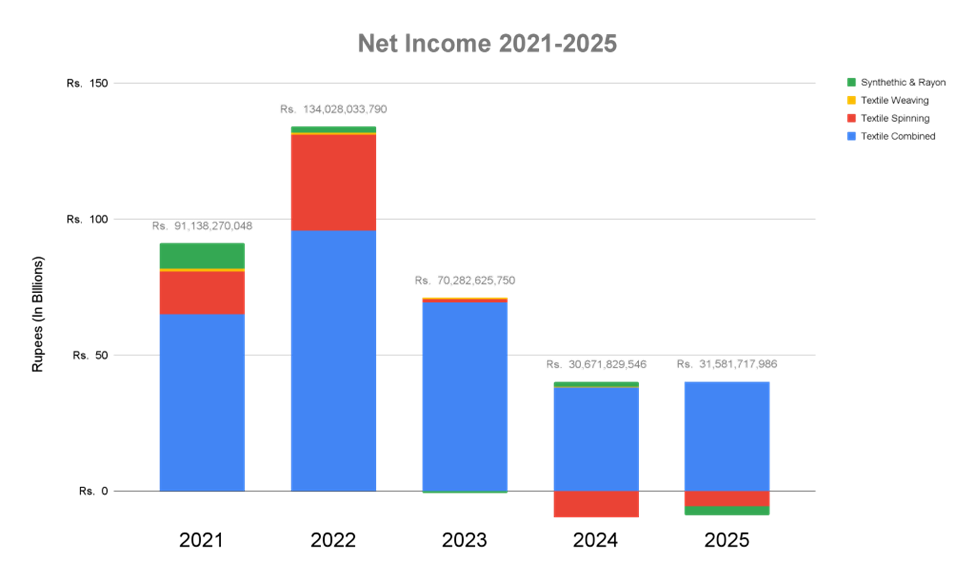
The industry is currently grappling with a "Profitability Paradox." The sector has transitioned from the "Golden Year" of 2022, which saw record-high net incomes, to a regime of operational deficits. Despite the 100% revenue growth in Textile Combined since 2021, absolute Net Income for the segment contracted by 58% from its 2022 peak (Rs. 95.76 billion) to 2025 (Rs. 40.28 billion). This is seen in Net Income 1.
The downturn is even more severe in specialized sub-sectors:
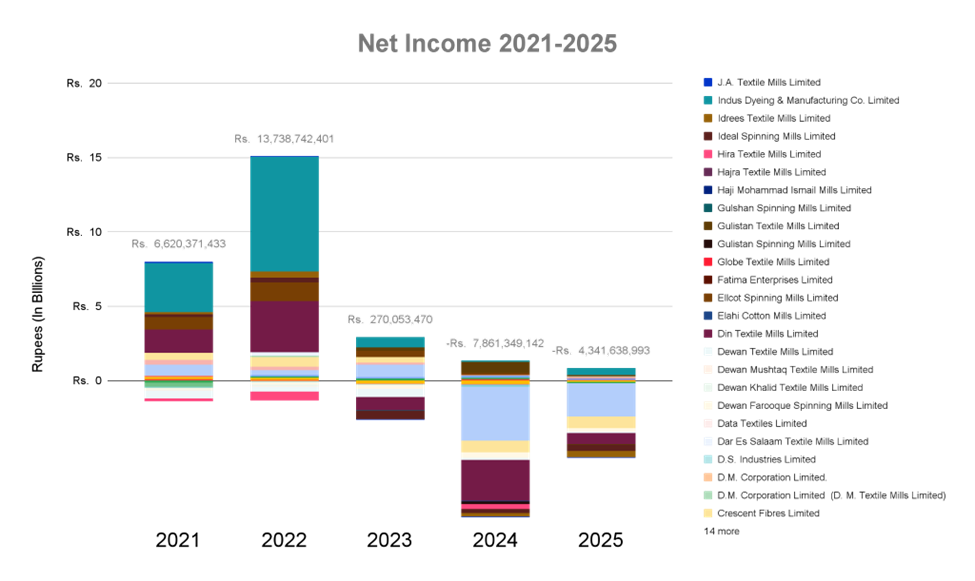
- Textile Spinning: This segment experienced a total loss of pricing power, swinging from a peak profit of Rs. 35.25 billion in 2022 to a staggering net loss of Rs. 9.57 billion in 2024. See chart Net Income 2.
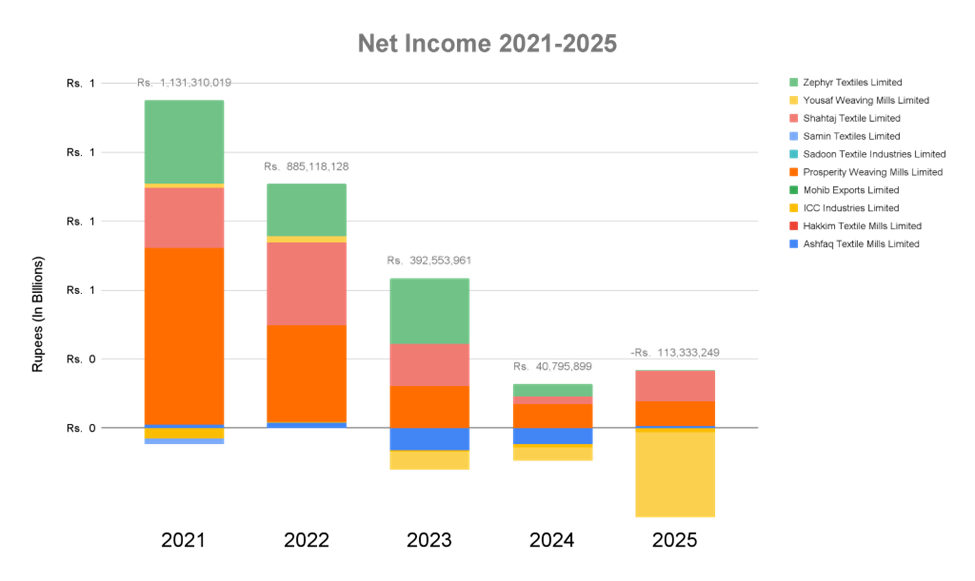
- Textile Weaving: Marginal profitability has evaporated, culminating in a net loss of Rs. 113.33 million by 2025. See chart Net Income 3.
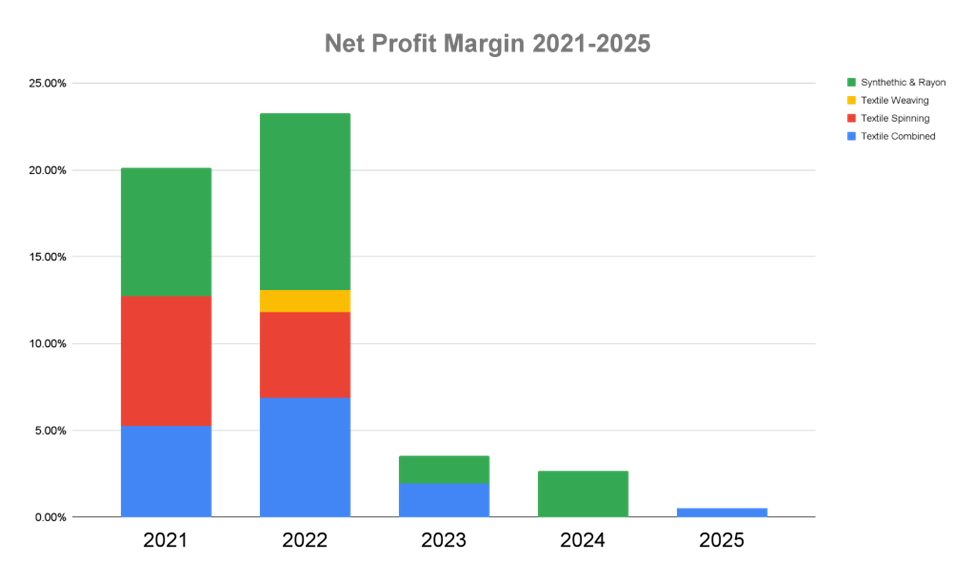
The collapse of Net Profit Margin (NPM) across the board highlights this distress. In Textile Combined, NPM plummeted from 6.90% in 2022 to a razor-thin 0.53% by 2025. Even more alarming is the Spinning sector, which saw NPM drop from 7.49% in 2021 to effectively negative levels, signaling a complete lack of operating leverage. These margin compressions have fundamentally destabilized capital efficiency metrics, leading to widespread equity erosion. As part of Net Profit Margin 1.
Capital Efficiency (ROE & ROA)
Return on Equity (ROE) and Return on Assets (ROA) are the ultimate barometers of industrial viability. Current data suggests a state of extreme financial instability and systemic "mean reversion" to the downside.
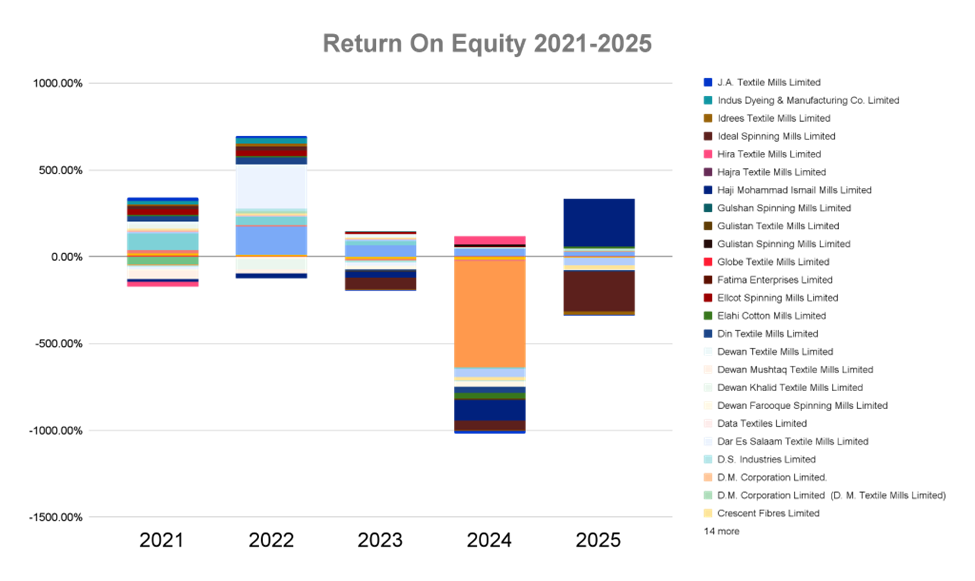
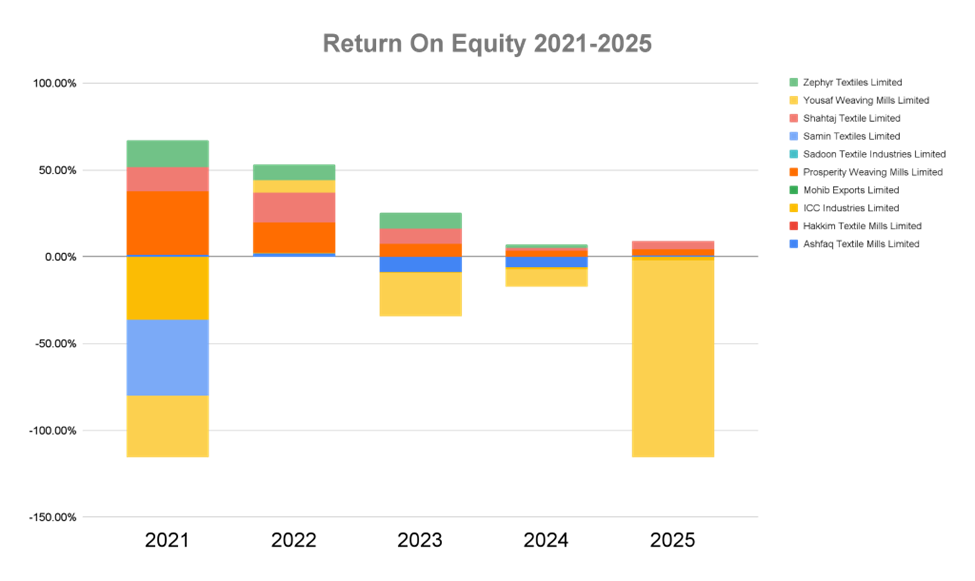
The ROE across the sector has effectively collapsed. Textile Spinning, which provided a 7.49% return in 2021, and Textile Weaving, which sat at 1.28% in 2022, have both reported 0.00% ROE throughout the 2023–2025 period. In research terms, a "0.00%" ROE in a high-inflation environment is not a neutral performance; it represents massive capital destruction and a total impairment of shareholder equity. For these details refer to charts ROE 1 & ROE 2.
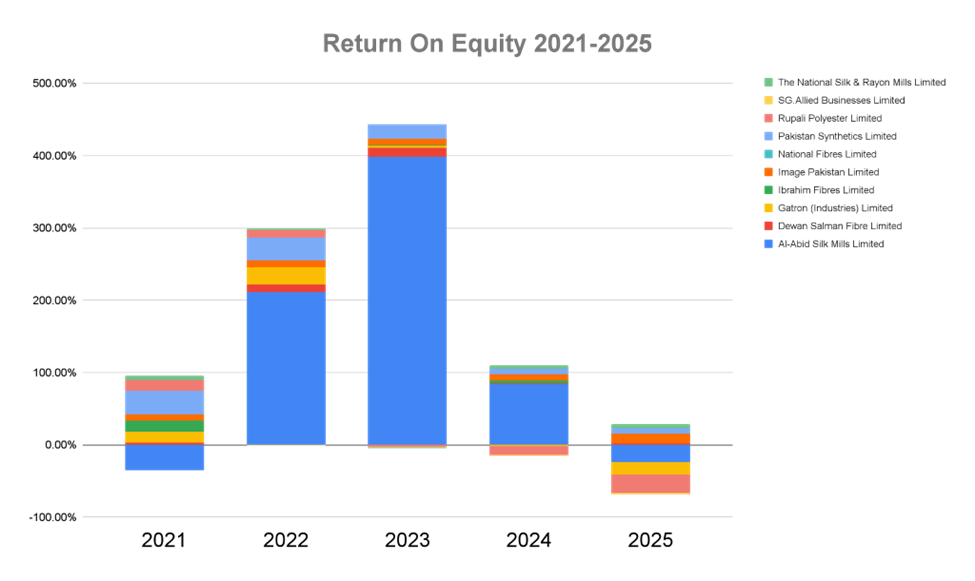
Return on Assets (ROA) further underscores this capital inefficiency. The Synthetic & Rayon sector recorded a negative ROA of -0.50% in 2025, indicating that the segment is actively destroying value for every rupee of assets held. The years 2024 and 2025 must be viewed as a period of "Strategic Risk," where returns have dropped below the cost of capital, making many specialized mills technically insolvent without substantial restructuring. This broader sectoral decay, however, masks a significant divergence in the performance of individual market participants. This is seen in ROA 1.
Strategic Risk Assessment
Sectoral averages provide a false sense of security; the current cycle has created a sharp divide between "survivors" and "casualties." A bottom-up analysis of individual balance sheets reveals a widening spread in performance.
- The Resilient: Large, vertically integrated players like Interloop Limited and Gul Ahmed Textile Mills have utilized scale to maintain positive earnings. Interloop is a standout performer, maintaining a healthy 2025 Net Profit Margin of 9.74%.
- The High-Risk: At the opposite end of the spectrum, specialized players are facing an existential crisis. Quetta Textile Mills reported a catastrophic Net Profit Margin of -100.65% in 2025, with a net loss of Rs. 1.63 billion. Similarly, Dewan Salman Fibre has faced persistent losses, peaking at a Rs. 2.19 billion deficit in 2023.
- Systemic Reporting Risks: A critical anomaly exists with Ibrahim Fibres Limited, the largest player in the Synthetic segment. The mill reported Rs. 0 revenue and income for 2022, 2024, and 2025. This zero-activity reporting from a major entity signals significant systemic risk, potential operational halts, or extreme reporting lags that distort sectoral health indicators.
Institutional Conclusion: The Pakistan textile industry is entering an inevitable consolidation phase. While the sector appears to be growing in scale (revenue), it is shrinking in efficiency and value. Integrated Combined mills are surviving by absorbing the shocks that are bankrupting the Spinning and Weaving tiers. For institutional stakeholders, the "growth" narrative is dead; the focus must shift entirely to margin sustainability and capital preservation. Immediate strategic risk re-evaluation is required as the industry bifurcates into a few integrated survivors and a long tail of impaired assets.
Disclaimer: This content is published solely for awareness, educational, public information, and journalistic purposes. All data is sourced from Pakistan Stock Exchange (dps.psx.com.pk) and relavant companies website.